Volunteer participation in the U.S. is shaped by age, family stage, education, income, and even whether service happens online or in person. The latest volunteer demographics do not point to one typical helper; they show several overlapping patterns that matter for nonprofits, schools, and civic groups. In this article, I break down the current numbers, explain why different federal surveys can seem to tell slightly different stories, and show how to use the data without flattening people into stereotypes.
The current profile is broader, older, and more flexible than a simple stereotype suggests
- 75.7 million Americans age 16+ formally volunteered between September 2022 and September 2023, or 28.3% of that population.
- More than half of Americans, 54.2%, helped neighbors informally in the same period.
- Women still participate at higher rates than men in day-level volunteering data, and participation generally rises with age.
- The fastest rebound between 2021 and 2023 came from millennials, Asian and Pacific Islander respondents, Hispanic respondents, people with less than a high school education, and people with family income below $25,000.
- Virtual and hybrid volunteers made up 18% of formal volunteers, and they averaged more hours than in-person-only volunteers.
What volunteer demographics actually tell us
I read the data in two layers. One layer tracks formal volunteering through organizations over a 12-month window; another looks at what people do on an average day. If you mix those up, the numbers can look contradictory when they are really measuring different behaviors.| Measure | What it captures | Why it matters |
|---|---|---|
| Annual formal volunteering | People who volunteered through an organization at least once during the past year. | Best for understanding the size of the organized volunteer base. |
| Average-day volunteering | People who volunteered on a given day in a time-use survey. | Better for seeing who shows up in daily life and how participation varies by age and sex. |
| Informal helping | Neighbor-to-neighbor support such as errands, rides, or lending tools. | Shows community care that never appears in nonprofit rosters. |
| Virtual or hybrid service | Volunteer work done fully or partly online. | Reveals how flexibility and access are changing the shape of service. |
The U.S. Census Bureau and AmeriCorps measure formal volunteering through the Current Population Survey supplement, while a separate Bureau of Labor Statistics time-use survey captures average-day activity. That distinction matters because a person can be a regular volunteer, a one-time helper, or an online contributor depending on the lens you use. I find that distinction more useful than any single headline number, because it keeps the data honest and the interpretation practical. That is the right place to start before looking at who is volunteering today.
The current U.S. volunteer profile in one glance
Once you strip the data down to its strongest signals, the picture gets clearer. The rebound is real, but the way people serve has changed: more Americans are volunteering again, yet they are often doing it in shorter bursts and through more flexible channels.
| Indicator | Latest signal | What it suggests |
|---|---|---|
| Formal volunteer rate | 28.3% of Americans age 16+ between September 2022 and September 2023 | Organized volunteering has largely recovered from its pandemic low, though it has not fully returned to pre-pandemic levels. |
| Estimated number of formal volunteers | 75.7 million people | The base of potential repeat volunteers is large, which makes retention as important as recruitment. |
| Total hours served | 4.99 billion hours | The sector still depends on a massive amount of unpaid labor, even when the per-person commitment is falling. |
| Economic value | More than $167.2 billion | Volunteer labor is not symbolic; it has measurable community and financial value. |
| Average annual hours per volunteer | 70 hours in 2023, down from 96.5 hours when tracking began in 2017 | People are serving, but many are serving less often or in smaller chunks. |
| Median annual hours | 24 hours in the latest data, down from 40 hours in 2017 | The typical volunteer is not deeply embedded in one long service pattern; episodic service is becoming more common. |
What matters most here is not just the headcount, but the drop in hours per volunteer. For organizations, that changes staffing assumptions, project design, and the way you think about commitment. The next question is who is showing up most often, and that is where age and life stage become hard to ignore.
Age and life stage shape participation more than most people expect
The age pattern is not a straight line. In the 2021 civic engagement supplement, Generation X had the highest formal volunteering rate, while teens ages 16 to 17 and adults ages 45 to 54 were also near the top. In the 2022 time-use data, participation on an average day rose with age and peaked among adults 65 and older, with women in that group reaching 7.8% and men 6.4%.
| Life stage | Pattern in the data | Interpretation |
|---|---|---|
| Teens and young adults | Strong participation appears when service is linked to school, family, or a clear short-term task. | Recruitment works better when the ask is specific and time-limited. |
| Parents with children under 18 | Formal volunteering was 30% for parents with children under 18, versus 21% for those without children in the household. | Families often volunteer when the opportunity fits the family calendar and feels safe to do together. |
| Midlife adults | Generation X stood out in the 2021 data, but time pressure is still a constraint. | Midlife volunteers often want reliable schedules and clear expectations rather than open-ended roles. |
| Older adults | Adults 65 and older led the average-day measure in 2022. | Retirement can open time for service, but accessibility and transportation still matter. |
| Millennials | They showed the largest relative gain between 2021 and 2023. | Flexible, purpose-driven roles can pull in people who are not ready for long, recurring commitments. |
I would not read age as a simple story of generosity or civic virtue. It is usually a story of time, access, and institutional ties. Once you add gender, race, education, and income, the picture becomes even more nuanced, which is exactly where many volunteer strategies go wrong.
Gender, race, education and income do not move together
One reason I trust the latest data is that it resists a neat, one-size-fits-all explanation. Women continue to volunteer at higher rates than men in the major federal measures, but the gap changes depending on whether you look at annual formal service or day-level participation. The 2021 supplement also showed that the drop during the pandemic was larger for women than for men, even though women still stayed ahead overall.
Women and men
In day-level data from 2022, women volunteered more than men, and the difference widened with age. That does not mean men are uninterested; it usually means the practical barriers are different. Men and women face different mixes of caregiving, work schedules, and preferred service settings, so the better question is not who is more virtuous, but what kind of opportunity each group can actually accept.
Read Also: Build a Strong Volunteer Program - 5 Steps to Success
Race, education and income
The strongest rebounds between 2021 and 2023 came from people who identified as Asian, Native Hawaiian or Pacific Islander, or Hispanic, along with people with less than a high school education and people in households with family income below $25,000. I read that as a reminder that participation is not reserved for one socioeconomic tier. It is also a warning against lazy assumptions: a higher income or a college degree may increase the odds of volunteering, but it does not define the whole volunteer base, and it certainly does not predict commitment on its own.
For community organizations, the useful insight is that outreach should not be built around a single demographic persona. The data point to multiple routes into service, not one standard path. That is why the format of volunteering matters just as much as the volunteer’s background.
Virtual and hybrid volunteering are changing the profile of service
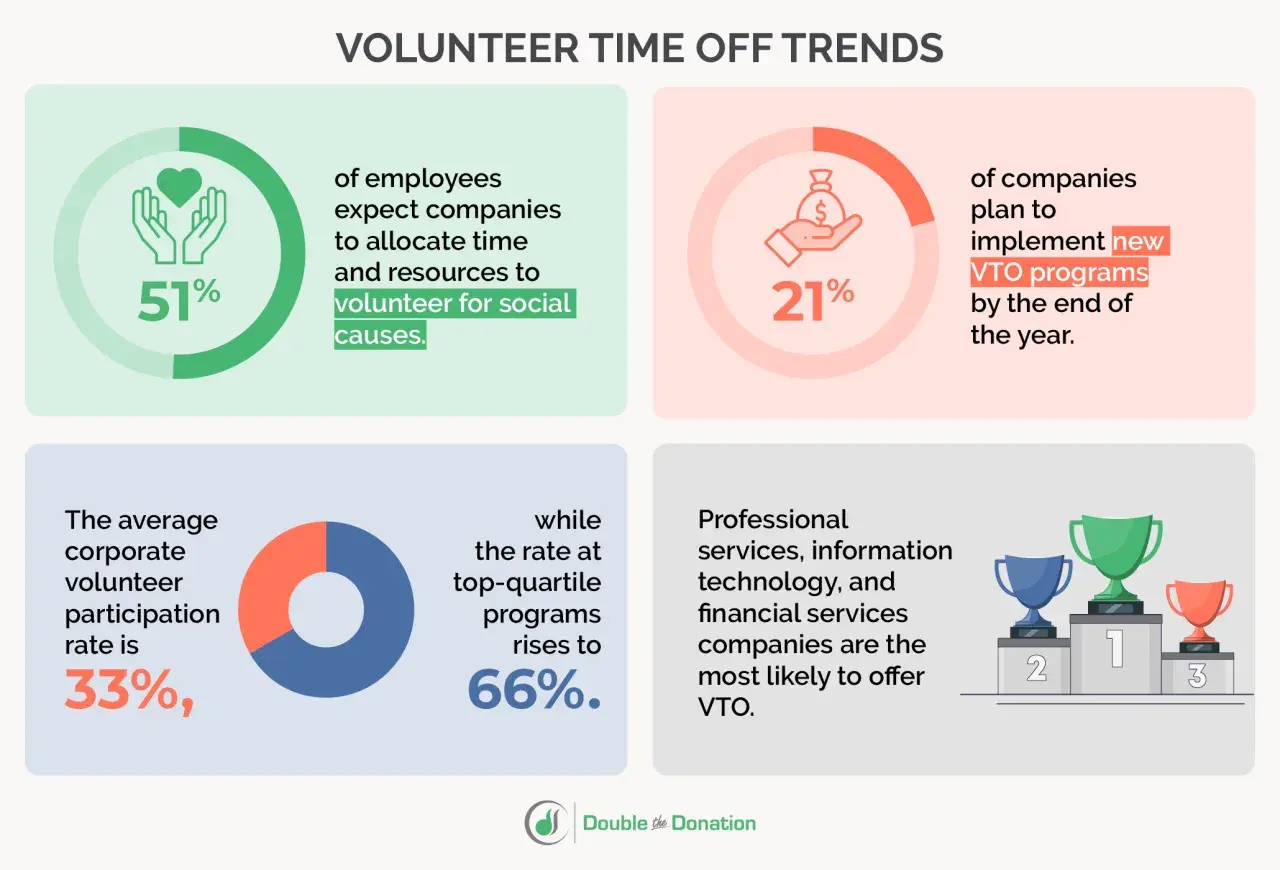
The newest shift in the data is not just who volunteers, but how they volunteer. In 2023, 18% of formal volunteers served completely or partially online, and more than 13.4 million people did some online volunteer work. That is not a niche behavior anymore; it is part of the mainstream volunteer mix.
- Virtual and hybrid volunteers reported 95 hours of service per year on average, compared with 64 hours for those who volunteered only in person.
- Six in 10 virtual and hybrid volunteers were under age 55.
- 10% of virtual and hybrid volunteers reported having a disability.
- The growing use of online service fits a broader move toward episodic volunteering, where people contribute in smaller, more manageable chunks.
I see two practical lessons here. First, digital options can widen access for people with mobility, schedule, or transportation limits. Second, online service does not automatically create more commitment; it often works because the role is clearer, narrower, and easier to start. That means recruitment and retention decisions matter as much as the platform itself.
How organizations should use this data without misreading it
Demographic data are useful only when they change behavior. If I were advising a nonprofit, school, or civic group, I would turn the numbers into design choices instead of slogans.
- Segment by behavior, not just age. Someone who shows up for one monthly shift is not the same as someone who leads a recurring program, even if they are in the same age band.
- Offer more than one entry point. Short tasks, family-friendly shifts, remote admin work, and weekend team days all attract different people.
- Make accessibility visible. If your roles can accommodate transportation support, captions, step-free entry, or online participation, say so upfront.
- Lower the first-contact barrier. A two-hour orientation can be enough to lose a volunteer before they ever begin.
- Track your own mix of volunteers. National averages are helpful, but your local profile may differ sharply by neighborhood, school district, or cause area.
- Do not overread one stat. A group can show strong growth without being the highest-participating group overall, so relative change and absolute rate both matter.
When organizations apply the numbers this way, they stop guessing at what volunteers want and start designing around actual behavior. That shift is usually where participation improves, because people respond to roles that fit real lives rather than idealized ones.
The 2026 read on volunteer participation is about access, not just attitude
The clearest lesson from the latest data is that volunteering in the U.S. is becoming more varied, not less. Some people give steady in-person time, some contribute online, some help neighbors directly, and many move between those modes depending on life stage and schedule. That variety is not a weakness; it is the shape of modern civic life.
If I had to compress the evidence into one practical takeaway, it would be this: the best volunteer programs in 2026 will be built for flexibility, clarity, and low-friction entry. The next round of federal data will show whether the rebound keeps holding, but you do not need to wait for that signal to adapt. The organizations that make room for different ages, incomes, abilities, and service styles are the ones most likely to build a durable volunteer base.